
Bitcoin BTC/USD Technical Analysis: Trend line Resistance Broken …
Bitcoin BTC/USD Technical Analysis: Trend line Resistance Broken to Upside
forextv.com / by: Timothy Kelly / 2 days ago
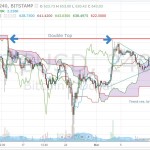
Bitcoin BTC/USD has broken the 4 hour resistance at around the $630-35 level in place over the past 4 sessions to reach a Sunday high of 652 but quickly retreating from the this level to the resistance line. Key Ichimoku levels are in play on the 4-hour as the pair has risen above the 4-hour cloud.
The pennant formed from the 711.12 has resumed the upside bias as our technical summary indicators show “strong buy” bias on the Bitcoin BTC/USD pair. Regaining 711, and a close higher will re-target 900-950 area. To the downside, a failure to hold the trend line break, sees 600 as initial support. Below 600 sees next support level at 550 area.
March 11th, 2014 | Tags:
,
,
| Category:
Jump to original –
Bitcoin BTC/USD Technical Analysis: Trend line Resistance Broken …
See which stocks are being affected by Social Media

