
Some Long-Term Charts At Key Inflection Points
Some Long-Term Charts At Key Inflection Points
Be aware of these surroundings, friends!
It could pay to be “aware of these surroundings!”
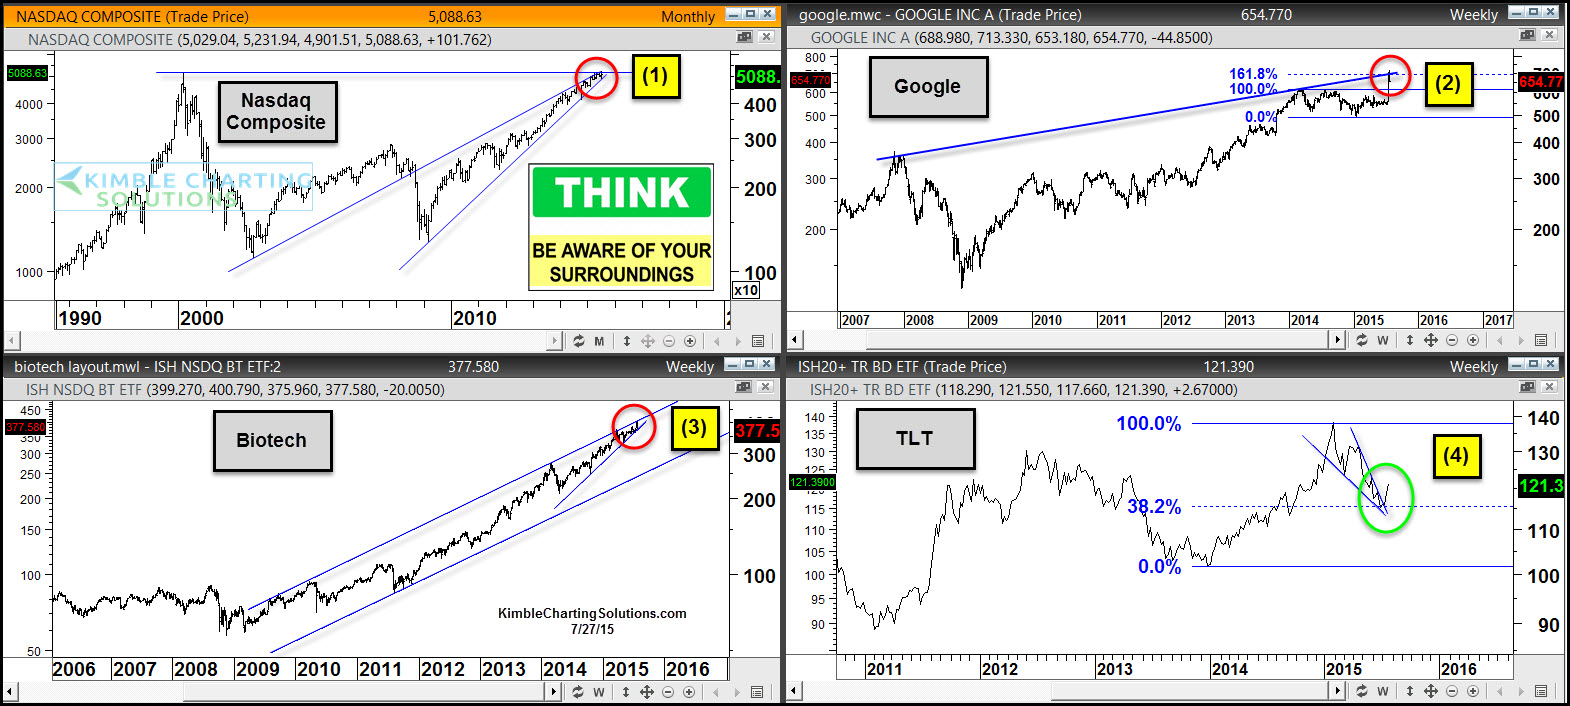
(1) – Nasdaq Composite Index (COMP) is back at 2000 highs, with little wiggle room at the top of this rising wedge pattern
(2) – Google (GOOG) (GOOGL) shot up after earnings two weeks ago hitting a resistance line based upon its 2007 highs and a 161% Fibonacci extension level, where it made a reversal pattern.
(3) – Red hot Biotech ETF (IBB) is at the top of this rising channel and created a potential reversal pattern with support just below current prices.
(4) – Treasury Bond ETF (TLT) declined, hitting its 38% retracement level and of late is breaking above this bullish falling wedge.
CLICK ON CHART TO ENLARGE
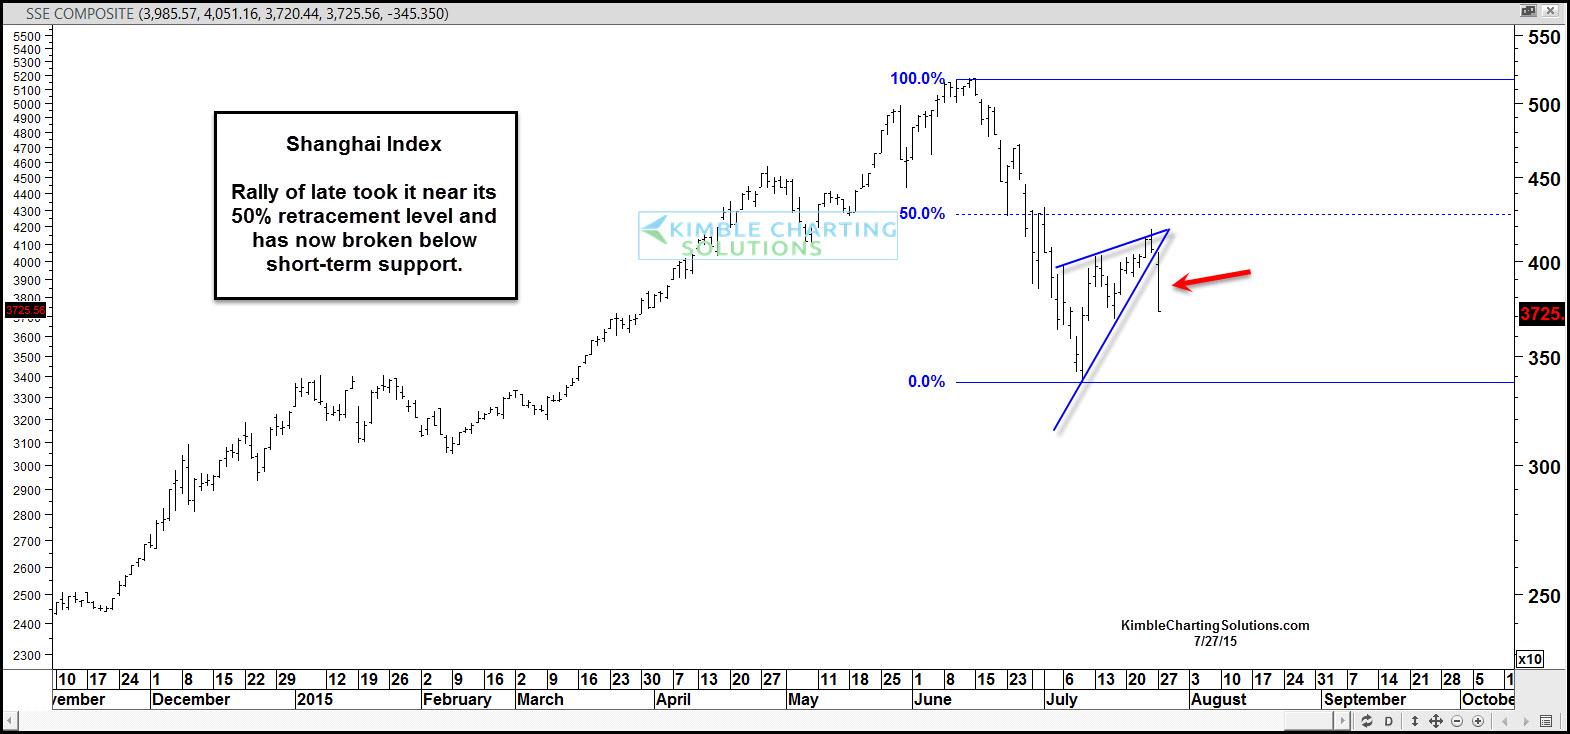
Shanghai Index (FXI) had a rough June, declining over 20%. This month a sharp counter trend rally has been taking place and the rally took it almost to its 50% retracement level. Today the Shanghai index broke short term support as it declined 8% in a day!
CLICK ON CHART TO ENLARGE
When you look at these patterns in stocks and bonds, it might pay to be aware of your surroundings because it would take little price action to break several support lines at the same time!
Courtesy of philstockworld.com
See more here:
Some Long-Term Charts At Key Inflection Points
See which stocks are being affected by Social Media

